
Describing visual data
Choose the correct option to complete each sentence about the charts.
This chart was designed for educational purposes only. Information and statistics in it may not be accurate.
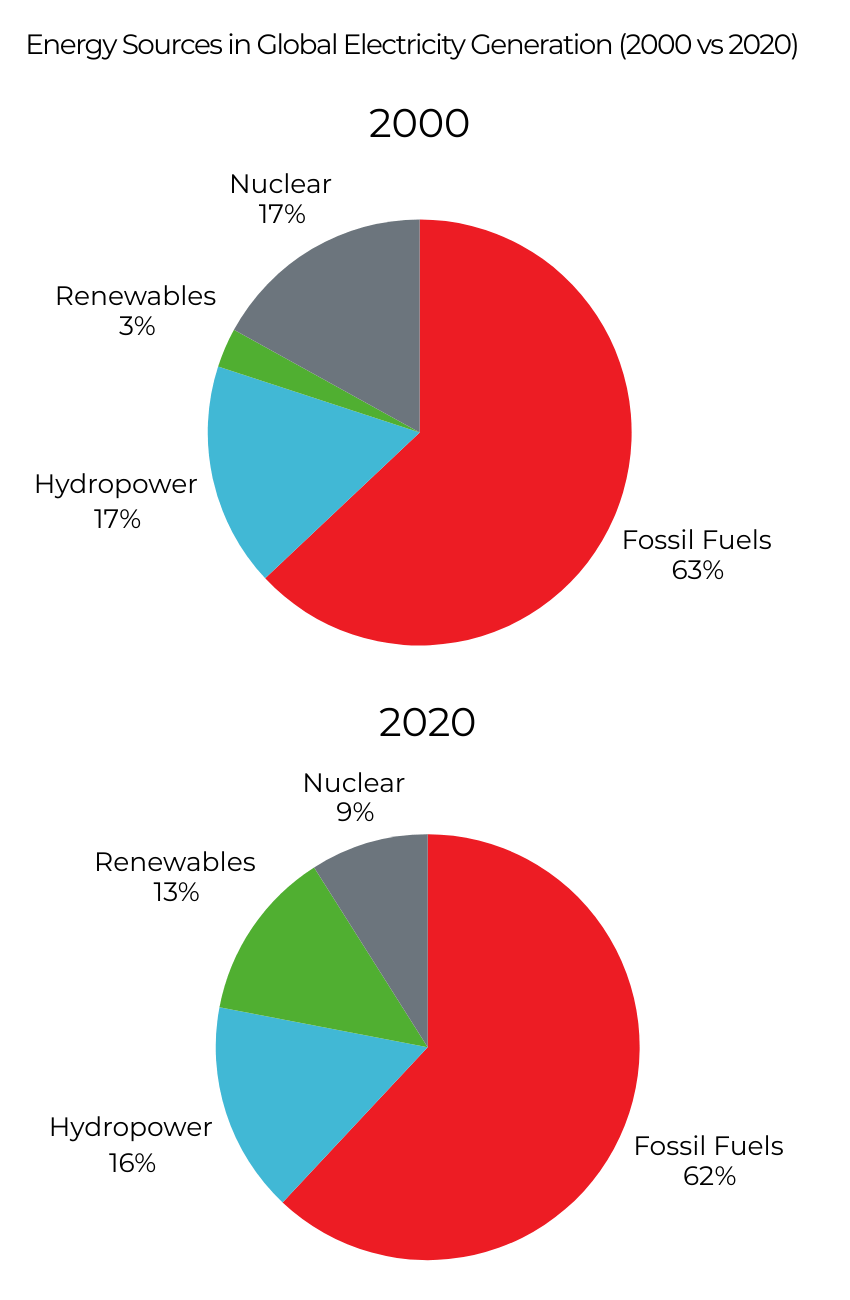
1In 2020, renewables accounted for a _____ of electricity generation than in 2000.
2Nuclear power experienced _____ of global electricity generation in 2020 compared with 2000.
3Hydropower _____ over the two decades.
4Fossil fuels experienced a _____ between 2000 and 2020.
5In 2000, renewables represented a _____ of electricity generation.
6By 2020, renewables represented _____ among the four energy sources.
7Compared with renewables, nuclear power saw a _____ over the period.
8Fossil fuels continued to account for _____ of electricity generation in both years.
9In 2020, hydropower accounted for a share that was _____ its level in 2000.
10The charts show that renewables underwent the _____ change of all four categories.